





Mid-market companies in the United States are more optimistic than the global average but Canadian business sentiment is lagging well behind.
The findings are from the latest Moore Thrive Index, a unique research project that combines the actual experience of leaders of mid-market companies over the past year with their confidence about the future on key measures that are crucial to success.
Globally, the Thrive Index score was +35.1, representing cautious optimism about the future. However, the US expectations of the next 12 months are much higher, reflected in a score of +40.6, while Canada is much more downbeat at only +26.0.
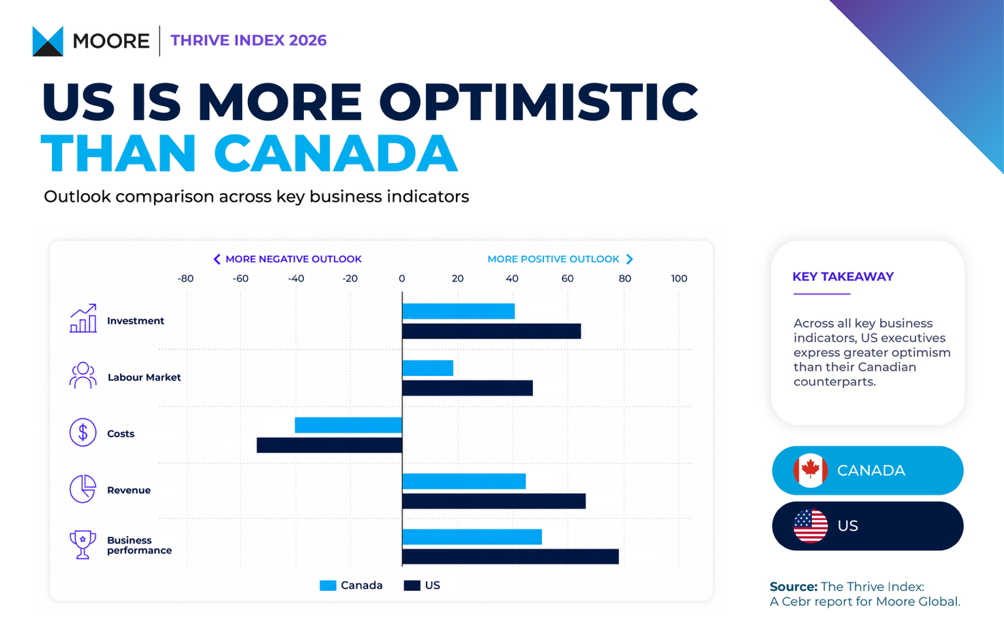
The differences can be explained, at least in part, by the huge disruption to US-Canadian trade which saw Canadian exports to the US fall by 5.8% in 2025. This was a fracturing in one of the world’s most successful integrated markets.
Moore’s Thrive Index captures the balance of positive to negative scores on five key pillars across 17 economies: business sentiment, revenue, costs, the labor market and investment.
US Strengths
The US outperformed the sample index average across all major pillars except costs, highlighting the relative resilience of the economy over the past year.
The strongest score was recorded in the business performance pillar, where the US achieved a score of +76.9 compared with the global average of +66.8. Companies reported solid operating conditions while remaining relatively optimistic about the outlook for the next 12 months.
Labor market conditions also remained comparatively strong but the weaker forward-looking score relative to the past year suggests firms are becoming more cautious on hiring expectations.
The main area of weakness for US firms was costs, where they recorded significantly more negative scores than the sample average.
Persistent wage pressures, elevated financing costs and tariff-related increases in input prices are all impacting the cost base against a background of rising inflation.
Canadian Uncertainty
Labor costs are a big drain on confidence among Canadian business leaders and appear to be weighing on hiring intentions. Canada achieved an overall labor market score of just +26.7, compared to the global average of +41.6.
Less than half of Canadian businesses (40.0%) expect to increase headcount over the next year relative to the past year – while one-in five expect to shed workers.
More broadly, 2025 saw the slowest pace of GDP growth in Canada since 2020, at 1.7%. In particular, Canada faced heightened trade uncertainty and volatility due to its higher exposure to US tariff-related developments, which weighed on external demand and export performance.
That may partly explain why Canada recorded a score of +57.3 on the backward-looking business performance pillar, compared to the index average of +68.8. Looking ahead, business performance expectations eased further, resulting in an index score of +49.3.
North America v Global
Overall performance by the world’s mid-market businesses has been remarkably resilient over the past 12 months but firms expect lower revenues over the next year which they say will impact employment and investment.
The latest Index score is unchanged from +35.1 recorded in 2025 – but the data reveals far greater uncertainty about the impact of geopolitical factors and technology disruption over the rest of the year.
Business performance remained strong over the past 12 months, with three-quarters of companies reporting improvements. Looking ahead, sentiment remains positive overall but there is much more caution about growth prospects.
The US was one of eight countries – along with South Africa, Saudi Arabia, UAE, India, China, Australia and Brazil – to record higher scores than the average. Besides Canada, there were below-average scores for European countries along with Japan.
The split starkly demonstrates the shifting balance of power in the world economy.
It is no coincidence that those countries powering ahead are either benefiting from the boom in critical mineral prices or the widespread adoption of AI and other digital technologies to carry out tasks once performed by human workers.
On almost every measure in the Thrive Index, IT and sectors rapidly adopting new technology are more optimistic about the future.
The Thrive Index scores represent the net balance of positive responses to each question by 2,425 business leaders across the world: that is, the share of positive respondents less the share of negative respondents.
A positive score signals that businesses are more positive on net and vice versa for a negative score. A score of zero indicates neutrality.
The key findings of the 2026 Moore Thrive Index:
- Business performance remained resilient, with 78% of businesses reporting improvements in their business performance over the last year. Looking ahead, sentiment remains positive overall but more cautious, reflecting uncertainty and subdued growth expectations amidst ongoing geopolitical tensions.
- Revenue performance across the sample strengthened over the last 12 months. However, optimism weakened for the year ahead, with the forward-looking score falling to +54.2 due to expectations of softer demand.
- Hiring intentions were positive on balance, but evidence points to a continued slowdown in labor market conditions for the coming year. This is reflected by the lower forward-looking labor market Index score of +36.6.
- The uncertain outlook for the year ahead appears to have weighed on investment intentions. Looking forward, the Thrive Index score is a relatively healthy +52.9 but that compares to +63.7 for the past 12 months. Investing in technology and digital tools remains the top priority for firms.